Monday, November 22, 2010

Project 4 - GIS and Transportation Report

The posted maps were created for the University of West Florida On-Line GIS certification program class, Special Topics in GIS (GIS 4930) as part of the Project 4 Report Week assignment focusing on using GIS and Transportation. In the weeks assignment we used territories similar to the ones outlined in the analyze phase to identify the top sales prospects in each sales region and find the optimal route to visit all 10 sites as efficiently as possible.

For now, I'm just posting my maps and will add more detail tomorrow:

Here are the optimal route maps for all three sales territories:

Northwest Territory Optimal Route


Northeast Territory Optimal Route


South Territory Optimal Route

Wednesday, November 17, 2010

Project 4 - GIS and Transportation Analyze

The posted maps were created for the University of West Florida On-Line GIS certification program class, Special Topics in GIS (GIS 4930) as part of the Project 4 Analyze Week assignment focusing on using GIS and Transportation. In the weeks assignment we had to create sales territories for three sales people for the Napa's Best wine company based on the prospects identified in the previous weeks maps.

The criteria for dividing the prospects into sales territories were:

1. Each territory should contain about 1/3 of the prospects with no more then a variance of two prospects between territories.
2. The level of sales potential for each territory should not vary more than +/- 5% from the average of the territories.


The first method for choosing territories required manually selecting sites using the GIS selection tools until the required number of sites was achieved and it was verified that the sites total sales potential met that criteria. The method is straightforward and easily allows for creating three balanced territories that appear on the map as distinct geographic areas.


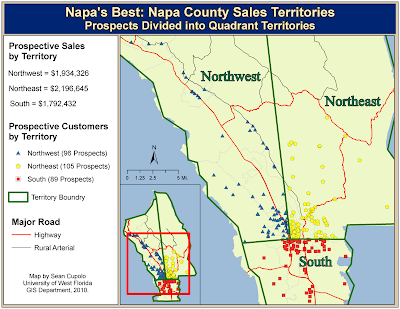
Two alternate methods for choosing territories were explored. The first method focused on trying to divide the sales area into quadrants that were divided somewhat equally with prospects also divided equally. The dividing lines for the quadrants are straight lines that do not attempt to preserve the prospect counts specifically, rather by having the line split prospects in a best fit manner that maintains as much as possible the proper division of prospects. Unfortunately, I could not seem to get the dividing lines to fit close enough and had a split of 89-96-105.


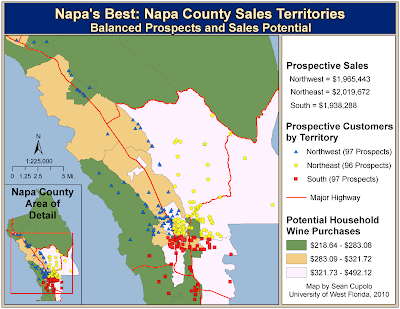
The final method focused on using existing roadways as borders for the territories. The map only displays the major roads, but in order to make sure the prospect split was correct, minor roads were incorporated, particularly in the population center where most of the prospects are concentrated. The splits for this layer were the best ones from a prospects and sales potential perspective at 96-97-97 split for prospects and a deviation from the average of the territories of no more than 2.3%, well under the 5% threshold. Additionally, setting up the territories using roadways allowed for consideration of travel times and routing of sales calls such that certain prospects were shifted to a territory based on the travel path to them.

For these reasons, it was recommended that Napa's Best choose the third option, territories based on roadway borders to set up the sale territories in Napa County.

The final map displays the recommended territory layout and contains some additional graphing to help illustrate why this method was best.

Tuesday, November 9, 2010

The posted map was created for the University of West Florida On-Line GIS certification program class, Special Topics in GIS (GIS 4930) as part of the Project 4 Prepare Week assignment focusing on using GIS and Transportation. The project will again focuses on business and marketing aspects of a GIS, this time on using GIS to help a fictional wine company, Napa's Best (NB), define sales territories and identify prospective customers in Napa County, California.


The objectives for the Preparation week were to:

1) Create and explore a base map of Napa County depicting number of households by census tract.
2) Display prospective customer stores by location and store type.
3) Explore average household restaurant and liquor store purchases by census tract.
4) Calculate and display wine purchases by household by census tract.

I chose to combine the four thematic (choropleth) maps and the base map into one map to allow for the viewer to easily compare census tract data. I decided to do the main map in a larger scale to allow for more separation between the symbols for each prospective customer. I could do so because the outer parts of the county do not contain any stores and have smaller concentrations of population over a wider area which meant the entire base map did not need to be displayed at the higher scale, just the part that had the geographic features important to the overall theme. Symbolizing choropleth part of the inset map for household numbers in the same color scheme allows for the viewer to make the connection to the distribution of stores in the main map as applied to the county as a whole as seen in each of the other maps. Also, the shape of the county lent itself to such a design as the sales distribution choropleth maps could be squeezed closer together allowing more room to display the base map. I did cheat a little on the bottom map, extending it over the border of the two top ones, but I actually think that touch adds a little pizazz to the map and helps to tie all three choropleths together as thematically similar elements.

Monday, November 1, 2010

Market Analysis Week 3 Report

The link below is to my final submission for the Market Analysis project. It is a power point presentation tying together the prepare and analysis phase work from the previous two weeks to select a new site for a fictional bookstore, Better Books, in the San Francisco market.


Week 3 Better Books Market Analysis Report

Monday, October 25, 2010

The posted maps were created for the University of West Florida On-Line GIS Certification Program class, Special Topics in GIS (GIS 4930) as part of the Project 3 - Analysis week assignment focusing on using GIS as a tool for market analysis.


For the analysis week, two additional market areas were defined for the existing Better Books stores to try to determine which market area best represents the distribution of Book Club Lovers Members for each of the stores. Remember, from last week the first defined market area was a 1-mile buffer around the store. The second market area is based on percentage of store sales to book club members wherein 0-60% of a stores sales are made by members within the inner ring and 60-80% of the stores sales are made by members in the outer ring. The third market area is defined based on driving times. It has an inner ring composed of members within a 0 - 1 minute drive time and the outer ring is within a 1 - 3 minute drive time.

Based on comparisons made using data from the GIS obtained mostly through spatial queries (i.e selection by location) and the summarize function, the 0%-60%/60%-80% model was chosen to be the best model to use for market analysis due to it's demographic and sales information being the closest to the actual distribution of Book Club Lovers Members. Further analysis from the data compiled last week shows that the Steiner store should be the model for locating the new site as it has higher sales, higher average sale per order and per customer and has a lot more positive demographics then the Bosworth store based on the 0%-60%/60%-80% market area report (More households, higher average income, net worth and home values, higher population growth, greater diversity).


With the model store identified, new properties can now be evaluated to look for similar demographic information. Six properties are available but only three meet the initial criteria for new sites (one was rejected because it was zoned for industrial use, the other two where with the 1-mile market are of the two existing stores). The demographic information for the three sites will be compared and reported during the Report phase of the assignment.

Sunday, October 17, 2010

Special Topics Project 3 Prepare: GIS and Economic Development

The posted maps were created for the University of West Florida On-Line GIS certification program class, Special Topics in GIS (GIS 4930) as part of the Project 3 Prepare Week assignment focusing on using GIS as a tool for market analysis. The project will be focused on locating the best site for a new book store for a family-owned retail chain that has two stores in the San Francisco area called Better Books.

During the Prepare phase we were asked to do some basic market analysis research using GIS to review demographics and competitors as wells as to look at customer characteristics in relation to store locations.

The first map shows demographics by population block groups in the San Francisco area that are indicators of possible book-buying customers along with the locations of competitor stores classified by yearly sales:


The map was fairly easy to create. The biggest challenges being choosing appropriate symbology for all the elements and then deciding on the best possible layout. I chose to use the library symbol to represent the Better Books stores but made each a different color. You'll see why on the second map.

For each of the block group choropleth parts of the map, I wanted to use fairly muted colors so that the store points for both Better Books and it's competitors would show up. The problem with doing that was the low classifications generally had a color value of white which did not look good against the white background. I played with the color ranges a little bit to make sure I good get the colors to pop a little more. I used green for the money demographics for obvious reasons (money is green).

The second map shows the results of establishing a 1-mile market area buffer around each of the Better Books sites and using it to perform calculations on the demographic data from the census blocks as well as from a separate point data layer that contains sales data on the buying habits of members of a book club, Booklovers:


Again, the map was not too difficult to generate but the spatial data within it was used to perform a number of calculations on customers and potential customers within the market areas of each current store. I figured to lend more credence to my choice of store symbol, I'd go ahead and use the library symbol to create a logo for Better Books and used it to fill some empty map space. I envision the motto of Better Books to be, "Twice as good as going to the Library".

As you can see, this weeks work was not as stressful as the last two projects, so I was able to have a little more fun and focus a little more on map design.

Sunday, October 10, 2010

Special Topics Project 2 Report: Urban Landscaping

This week concludes the second project for the University of West Florida On-Line GIS Certification course, Special Topics in GIS (GIS 4930) which focused on urban landscaping design concepts.

The first task for report week required summing up and extending the project goals for the previous two weeks in trying to show quantitative reasons for Marin City, California to continue to provide 25% matching funds to a the Marin City Tree Program in order for it to continue to receive federal grants for tree planting and maintenance under the Small Business Stewardship Assistance Act of 2010. I have presented this data via a report which is meant to be presented to the Marin City Manager which can be accessed via this link:

Report to Marin City Manager

The second task focused on a request to determine how many trees need to be planted to offset half the energy use of a proposed project to build the Marin City Center, a multi-use community building in the northwest part of the city. I have also chosen to present the data in the form of a report that can be accessed by this link:

Report on Marin City Center Energy Usage