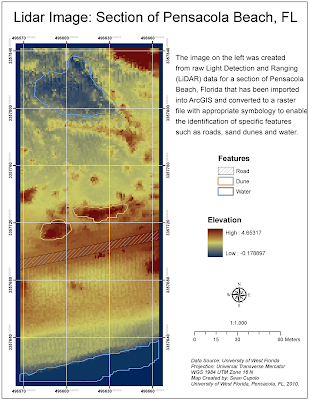
To create the image, the LiDAR data was converted into a point file using the Add XY Data tool in ArcGIS and then exported as a shape-file which was then converted to a raster file using the IDW Spatial Analyst tool. The rater image was given a stretched symbology to enable the identification of features and then symbolized using color scheme showing contrasting colors for low to high elevations, in this case darker blue tones for the lower elevations and orange-red for the higher elevations. The contrasting tones contribute to the ability to identify features of which there where three types we were asked to highlight - a road, sand dunes and water. To show these features, a new polygon layer was added and each feature was outlined in the polygon layer and then symbolized separately after adding a feature identification field to the polygon layer. The map was then laid out with a grid to show the projection system used for the original LiDAR data set.
Everything seemed to go pretty smoothly for the challenge, the biggest issue being deciding how to add a header to the original dataset to make sure ArcMap could identify the X, Y and Z columns. The ID polygons took some time to get correct but only because I kept closing them too soon and had to redo them.

No comments:
Post a Comment