Monday, November 22, 2010

Project 4 - GIS and Transportation Report

The posted maps were created for the University of West Florida On-Line GIS certification program class, Special Topics in GIS (GIS 4930) as part of the Project 4 Report Week assignment focusing on using GIS and Transportation. In the weeks assignment we used territories similar to the ones outlined in the analyze phase to identify the top sales prospects in each sales region and find the optimal route to visit all 10 sites as efficiently as possible.

For now, I'm just posting my maps and will add more detail tomorrow:

Here are the optimal route maps for all three sales territories:

Northwest Territory Optimal Route


Northeast Territory Optimal Route


South Territory Optimal Route

Wednesday, November 17, 2010

Project 4 - GIS and Transportation Analyze

The posted maps were created for the University of West Florida On-Line GIS certification program class, Special Topics in GIS (GIS 4930) as part of the Project 4 Analyze Week assignment focusing on using GIS and Transportation. In the weeks assignment we had to create sales territories for three sales people for the Napa's Best wine company based on the prospects identified in the previous weeks maps.

The criteria for dividing the prospects into sales territories were:

1. Each territory should contain about 1/3 of the prospects with no more then a variance of two prospects between territories.
2. The level of sales potential for each territory should not vary more than +/- 5% from the average of the territories.


The first method for choosing territories required manually selecting sites using the GIS selection tools until the required number of sites was achieved and it was verified that the sites total sales potential met that criteria. The method is straightforward and easily allows for creating three balanced territories that appear on the map as distinct geographic areas.


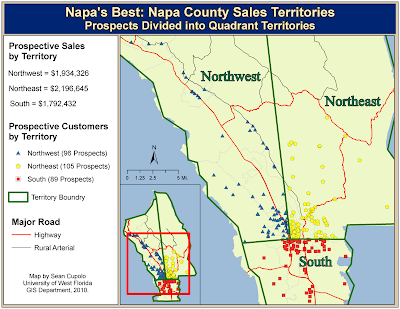
Two alternate methods for choosing territories were explored. The first method focused on trying to divide the sales area into quadrants that were divided somewhat equally with prospects also divided equally. The dividing lines for the quadrants are straight lines that do not attempt to preserve the prospect counts specifically, rather by having the line split prospects in a best fit manner that maintains as much as possible the proper division of prospects. Unfortunately, I could not seem to get the dividing lines to fit close enough and had a split of 89-96-105.


The final method focused on using existing roadways as borders for the territories. The map only displays the major roads, but in order to make sure the prospect split was correct, minor roads were incorporated, particularly in the population center where most of the prospects are concentrated. The splits for this layer were the best ones from a prospects and sales potential perspective at 96-97-97 split for prospects and a deviation from the average of the territories of no more than 2.3%, well under the 5% threshold. Additionally, setting up the territories using roadways allowed for consideration of travel times and routing of sales calls such that certain prospects were shifted to a territory based on the travel path to them.

For these reasons, it was recommended that Napa's Best choose the third option, territories based on roadway borders to set up the sale territories in Napa County.

The final map displays the recommended territory layout and contains some additional graphing to help illustrate why this method was best.

Tuesday, November 9, 2010

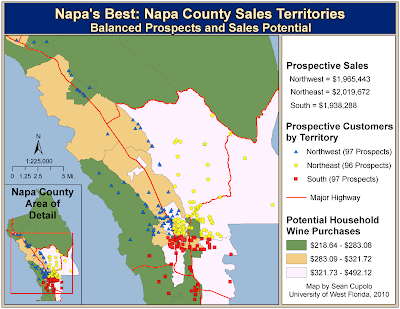
The posted map was created for the University of West Florida On-Line GIS certification program class, Special Topics in GIS (GIS 4930) as part of the Project 4 Prepare Week assignment focusing on using GIS and Transportation. The project will again focuses on business and marketing aspects of a GIS, this time on using GIS to help a fictional wine company, Napa's Best (NB), define sales territories and identify prospective customers in Napa County, California.


The objectives for the Preparation week were to:

1) Create and explore a base map of Napa County depicting number of households by census tract.
2) Display prospective customer stores by location and store type.
3) Explore average household restaurant and liquor store purchases by census tract.
4) Calculate and display wine purchases by household by census tract.

I chose to combine the four thematic (choropleth) maps and the base map into one map to allow for the viewer to easily compare census tract data. I decided to do the main map in a larger scale to allow for more separation between the symbols for each prospective customer. I could do so because the outer parts of the county do not contain any stores and have smaller concentrations of population over a wider area which meant the entire base map did not need to be displayed at the higher scale, just the part that had the geographic features important to the overall theme. Symbolizing choropleth part of the inset map for household numbers in the same color scheme allows for the viewer to make the connection to the distribution of stores in the main map as applied to the county as a whole as seen in each of the other maps. Also, the shape of the county lent itself to such a design as the sales distribution choropleth maps could be squeezed closer together allowing more room to display the base map. I did cheat a little on the bottom map, extending it over the border of the two top ones, but I actually think that touch adds a little pizazz to the map and helps to tie all three choropleths together as thematically similar elements.

Monday, November 1, 2010

Market Analysis Week 3 Report

The link below is to my final submission for the Market Analysis project. It is a power point presentation tying together the prepare and analysis phase work from the previous two weeks to select a new site for a fictional bookstore, Better Books, in the San Francisco market.


Week 3 Better Books Market Analysis Report

Monday, October 25, 2010

The posted maps were created for the University of West Florida On-Line GIS Certification Program class, Special Topics in GIS (GIS 4930) as part of the Project 3 - Analysis week assignment focusing on using GIS as a tool for market analysis.


For the analysis week, two additional market areas were defined for the existing Better Books stores to try to determine which market area best represents the distribution of Book Club Lovers Members for each of the stores. Remember, from last week the first defined market area was a 1-mile buffer around the store. The second market area is based on percentage of store sales to book club members wherein 0-60% of a stores sales are made by members within the inner ring and 60-80% of the stores sales are made by members in the outer ring. The third market area is defined based on driving times. It has an inner ring composed of members within a 0 - 1 minute drive time and the outer ring is within a 1 - 3 minute drive time.

Based on comparisons made using data from the GIS obtained mostly through spatial queries (i.e selection by location) and the summarize function, the 0%-60%/60%-80% model was chosen to be the best model to use for market analysis due to it's demographic and sales information being the closest to the actual distribution of Book Club Lovers Members. Further analysis from the data compiled last week shows that the Steiner store should be the model for locating the new site as it has higher sales, higher average sale per order and per customer and has a lot more positive demographics then the Bosworth store based on the 0%-60%/60%-80% market area report (More households, higher average income, net worth and home values, higher population growth, greater diversity).


With the model store identified, new properties can now be evaluated to look for similar demographic information. Six properties are available but only three meet the initial criteria for new sites (one was rejected because it was zoned for industrial use, the other two where with the 1-mile market are of the two existing stores). The demographic information for the three sites will be compared and reported during the Report phase of the assignment.

Sunday, October 17, 2010

Special Topics Project 3 Prepare: GIS and Economic Development

The posted maps were created for the University of West Florida On-Line GIS certification program class, Special Topics in GIS (GIS 4930) as part of the Project 3 Prepare Week assignment focusing on using GIS as a tool for market analysis. The project will be focused on locating the best site for a new book store for a family-owned retail chain that has two stores in the San Francisco area called Better Books.

During the Prepare phase we were asked to do some basic market analysis research using GIS to review demographics and competitors as wells as to look at customer characteristics in relation to store locations.

The first map shows demographics by population block groups in the San Francisco area that are indicators of possible book-buying customers along with the locations of competitor stores classified by yearly sales:


The map was fairly easy to create. The biggest challenges being choosing appropriate symbology for all the elements and then deciding on the best possible layout. I chose to use the library symbol to represent the Better Books stores but made each a different color. You'll see why on the second map.

For each of the block group choropleth parts of the map, I wanted to use fairly muted colors so that the store points for both Better Books and it's competitors would show up. The problem with doing that was the low classifications generally had a color value of white which did not look good against the white background. I played with the color ranges a little bit to make sure I good get the colors to pop a little more. I used green for the money demographics for obvious reasons (money is green).

The second map shows the results of establishing a 1-mile market area buffer around each of the Better Books sites and using it to perform calculations on the demographic data from the census blocks as well as from a separate point data layer that contains sales data on the buying habits of members of a book club, Booklovers:


Again, the map was not too difficult to generate but the spatial data within it was used to perform a number of calculations on customers and potential customers within the market areas of each current store. I figured to lend more credence to my choice of store symbol, I'd go ahead and use the library symbol to create a logo for Better Books and used it to fill some empty map space. I envision the motto of Better Books to be, "Twice as good as going to the Library".

As you can see, this weeks work was not as stressful as the last two projects, so I was able to have a little more fun and focus a little more on map design.

Sunday, October 10, 2010

Special Topics Project 2 Report: Urban Landscaping

This week concludes the second project for the University of West Florida On-Line GIS Certification course, Special Topics in GIS (GIS 4930) which focused on urban landscaping design concepts.

The first task for report week required summing up and extending the project goals for the previous two weeks in trying to show quantitative reasons for Marin City, California to continue to provide 25% matching funds to a the Marin City Tree Program in order for it to continue to receive federal grants for tree planting and maintenance under the Small Business Stewardship Assistance Act of 2010. I have presented this data via a report which is meant to be presented to the Marin City Manager which can be accessed via this link:

Report to Marin City Manager

The second task focused on a request to determine how many trees need to be planted to offset half the energy use of a proposed project to build the Marin City Center, a multi-use community building in the northwest part of the city. I have also chosen to present the data in the form of a report that can be accessed by this link:

Report on Marin City Center Energy Usage

Sunday, October 3, 2010

Project 2: GIS and Landscape Design: Part 2 Analyze


Project 2 in GIS 4930 Special Topics in GIS focuses on GIS and Landscape Design/Management. The scenario involves using a GIS to answer questions related to Small Business Environmental Stewardship Assistance Act of 2010 which encourages communities to plant trees in urban neighborhoods in order to revitalize communities.

In the preparation phase ortho-images of Marin City, CA were reclassified to identify three distinct classes of ground cover - Trees, Grasses and Impervious Surfaces. Once reclassification was completed using ArcGIS Spatial Analysis tools, the analyze phase focused on looking at calculating percent tree cover, carbon storage and carbon sequestration for five selected neighborhoods within the city area. The analysis performed is a good demonstration of the way a GIS can be used to derive quantitative spacial information about an area from a basic image.

Using the reclassified image, each neighborhoods ground cover classifications were extracted allowing for the calculation of the area, acreage and percent of total coverage for each class of land cover. The data from those calculations was used to calculate estimated carbon storage and carbon sequestration values for each neighborhood based on CITYGreen methods and equations. The result is the posted map which shows each of the five neighborhoods statistics allowing for the easy determination of which areas in Marin City are more likely to benefit from tree planting programs.

Monday, September 27, 2010

Project 2: Prepare

Project 2 in GIS 4930 Special Topics in GIS focuses on GIS and Landscape Design/Management. The scenario involves using a GIS to answer questions related to Small Business Environmental Stewardship Assistance Act of 2010 which encourages communities to plant trees in urban neighborhoods in order to revitalize communities. The act requires matching funds to be provided by the city and the City Manager is requesting a study to show some quantitative reasons to fund the program. Specifically, the GIS is being used to classify ground cover in Marin City, California to try to answer three questions: 1) How does the stewardship program currently benefit the city in terms of energy savings. 2) How does the program benefit the city in terms of carbon stored. 3)How can the program help to identify areas within the city that would benefit from planting more trees.

The first step in the process was to reclassifying ortho-images of Marin City into classified raster images that can be used to determine three general types of land cover classifications: Trees, Grasses and Impervious Surfaces. As part of the preperation process the following base map was created showing Marin County and Marin City with the area to be classified:

Monday, September 20, 2010

Special Topics Project 1 Report Phase

The posted maps were created as part of the first project in the University of West Florida On-line GIS certification course, Special Topics in GIS (GIS 4048). The project was a health study of air pollution, asthma and race in the San Francisco bay area. The study focused on looking at asthma hospitalization rates in the nine counties that make up the bay area to look for correlations between factors such as race and air quality.

The study had three separate analytical parts that required their own deliverables. Each of the maps posted here was part of one of those studies and they are being presented in the order of the study.

Public Health Analysis: Part 1 Demographics

The first part of the study was actually a separate study that took priority when the project leaders were notified that funds were available to help uninsured populations. The goal was to determine if there were any correlations between certain possible poverty indicators such as unemployment, race and single mother-hood and the uninsured population.


Public Health Analysis: Part 2 A Closer Look at Asthma

The second part of the study looked at the relation ship of race and air quality factors to the rate of asthma hospitalizations in the bay area. The goal was to try to determine if there was any correlation between these factors, determine which ones and locate both the target population and target county where funds would best be allocated to hospitals likely to receive the most asthma hospitalizations.


Public Health Analysis: Part 3

Part 3 of the study proceeds under the assumption that the previous phases of the study have shown a population most at risk of asthma hospitalization and the county that is the most likely to experience impacts from increased hospitalizations from the targeted population. The goal of this portion of the study was to look at where targeted asthma sufferers may suffer due to point sources of pollution and which hospitals are most likely to be utilized by the targeted population. The study mapped sources of pollution such as Toxic Release Index (TRI) point locations and roadways, hospitals and the distribution of the targeted population at the Census Tract level. These factors were compared via weighted overlays to identify the most likely "hot" zones where the proximity to a hospital, the pollution factors and the targeted population could most likely lead to increased use necessitating the need for an increase in staffing and funding.

Tuesday, September 14, 2010

Special Topics Project 1: Analyze Phase Post 1

The posted map was completed as part of the University of West Florida On-Line GIS Certification Program class, GIS 4930/5945 Special Topics in GIS. The Special Topics class is focusing on one geographic area, the San Francisco Bay Area, and studying various problems faced by city GIS managers and analysts in that area over the course of the semester.

The first class project focuses on GIS and Public Health by looking at possible race and environmental factors that may be related to asthma hospitalization rates in the nine counties that comprise the San Francisco Bay Area.

The posted map shows county asthma hospitalization rates per 10,000 people and it forms a base map that can be used for later p[arts of the study:


The map is a fairly straightforward thematic choropleth map that highlights the counties showing the highest rate of hospitalizations per 10,000 people in the bay area, specifically Alameda County. The map also shows some hospitals that are within the study area that are likely to be receiving many of the hospitalized patients.

The map was fairly easy to construct using ESRI ArcMap GIS software, the biggest challenges being choosing a suitable color scheme of the county data and a background that highlighted the map data. I annotized the County labels for this map so that I could move them to open areas of the map and fit in the legend and other pertinent map data while keeping the scale as large as possible.

Monday, September 6, 2010

Special Topics in GIS Project 1: Air Pollution, Ashtma and Race in San Francisco Bay Area

The following links were created for the first assignment in the University of West Florida's 2010 GIS Certification Program on-line course, Special Topics in GIS which began in the Fall 2010 semester.

The Special Topics class focuses on longer term projects centered on s specific area - the San Francisco Bay Area. The first project focuses on public health via a study that uses GIS to examine whether there is any correlation between asthma admittance rates in the nine counties that comprise the San Francisco bay area, air quality (based on ozone and particulate matter data) and racial demographics. The study initiators are local county hosptial officials who are looking into data to help develop resource allocation budgets for the county hospital system.

The prepare phase of the project required preparing demographic, air quality and asthma admittance data from various sources such as publications and the internet into a format that coud be utilized by the GIS and connected to spatial data utilized by the GIS (in this case the county geospatial data).

As all the GIS datasets were being created or altered from exiosting datasets, one of the project requirements was to update the metadata associated with each data file to reflects it's relevence to the current project and to provide future possible users of the data a way to understand what data was incorporated in the study for validation purposes.

What is posted here are the metadata files for all the datasets anticipated to be used in the project:

Demographics
Asthma Rates
Monthly Ozone
Particulate Matter

Bay Area Counties Shapefile
Bay Area Hospitals Shapefile
Bay Area Monitoring Stations Shapefile

In addition to ther preperaption of the data sets and the metadata, the Prepare phase required the production of a preliminary Process summary outlining the steps taken from inception to completion of the study and presentation of the data.

Sunday, July 25, 2010

Module 5 Challenge: LiDAR - Pensacola Beach Section

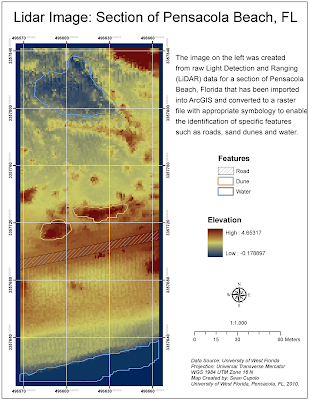
The map image below was created using ArcGIS with Light Detection and Ranging (LiDAR) data collected from an airplane over a section of Pensacola Beach, Florida. The image was created for the Week 5 LiDAR Module Challenge in the 2010 University of West Florida Online GIS Certification program class, Photo Interpretation and Remote Sensing (GIS 4035L).


To create the image, the LiDAR data was converted into a point file using the Add XY Data tool in ArcGIS and then exported as a shape-file which was then converted to a raster file using the IDW Spatial Analyst tool. The rater image was given a stretched symbology to enable the identification of features and then symbolized using color scheme showing contrasting colors for low to high elevations, in this case darker blue tones for the lower elevations and orange-red for the higher elevations. The contrasting tones contribute to the ability to identify features of which there where three types we were asked to highlight - a road, sand dunes and water. To show these features, a new polygon layer was added and each feature was outlined in the polygon layer and then symbolized separately after adding a feature identification field to the polygon layer. The map was then laid out with a grid to show the projection system used for the original LiDAR data set.

Everything seemed to go pretty smoothly for the challenge, the biggest issue being deciding how to add a header to the original dataset to make sure ArcMap could identify the X, Y and Z columns. The ID polygons took some time to get correct but only because I kept closing them too soon and had to redo them.

Monday, July 19, 2010

Module 4 Challenge: Supervised Classification

The link posted here is to a map created using ERDAS IMAGINE 2010 software as part of the University of West Florida On-line GIS Certification program class, Photo Interpretation and Remote Sensing (GIS4035/L). The link requires Internet Explorer to open and display properly.

Germantown Maryland

The image is a Supervised Maximum Likelihood classification from a satellite image of Germantown, Maryland classified for 14 land use types identified by spectral signatures identified using the ERDAS IMAGINE software. The process involved creating a unique spectral signature for each land use type by first creating an area of interest polygon around a specific known feature on the map in an attempt to capture pixel values that are unique to the feature and thus to the type of land use. Once the distinct signatures were created the software could reclassify the entire image using the signatures to show each of the land use type.

In theory the task was not too complicated. However, knowing when a specific signature covered enough pixels in the image was not an easy task, particularly after the assignment was changed to require that each land use contain pixel values in a certain range. In the end I got 12 of 14 within the proper ranges and was only off on the other two by a relatively small amount of pixels. However, after reclassifying signatures multiple times and regenerating the classified map 16 times, I feel I gave a tremendous effort to accomplish a task that just did not seem worthwhile as each successive classification once a certain point had been reached seemed to have a negligible effect on the image as a whole. In that respect I'm satisfied with the map regardless off the possible mark downs for these two classes that were only slightly out of the challenge parameters.

Monday, July 12, 2010

Module 3: Rectification Challenge

The link posted here is to a map created using ERDAS IMAGINE 2010 software as part of the University of West Florida On-line GIS Certification program class, Photo Interpretation and Remote Sensing (GIS4035/L). The link requires Internet Explorer to open and display properly.

The image is a rectified Landsat ETM+ satellite image of downtown Pensacola, Florida. Rectification is the process of making an image conform to a specific known projection system by referencing map coordinates on the image to a known source set of coordinates from an existing map or other resource, a process called georeferencing. In the challenge assignment, students had to georeference locations in the satellite image to like locations from a USGS topographic reference map. The process requires locating similar features on both maps and using ERDAS Imagine's Multipoint Geometric Correction workspace to place Geographic Control Points (GCPs) on both maps that the software can use to determine how accurate the reference is. The software does so by calculating a type of error called the Root Mean Square Error(RMSE) for each of the points. The lower the error can be made for each point, the more accurate the re projection of the image is. In our case, we were required to place at least seven control points with a total average error below 1.0; essentially within 1 Pixel value in the satellite image. I placed eight control points on the map and had a total average RMSE of 0.255 and a Total Control Point Error value of 0.3034.

Landsat ETM Image of Downtown Pensacola

I thought this was a fun lab. It is similar to an exercise we did with ArcGIS in Intro to GIS last semester but the level of error required was much much lower. However, I found that it wasn't too difficult to lower your error values after some trial and error experimentation with the software. Basically, you need to place a point in an identifiable location in the topographic map, then place the same point in the image and check what the error is. Once you have the value, blow the image up to an extreme size where each pixel can be seen distinctly. At that point you can move your control point on the satellite image and using the on-the fly RMSE values that change with each move essentially home in on where the point should actually be located. I think with a little practice I could get my RMSE below 0.1 if needed.

Monday, July 5, 2010

Module 2: Spectral Band Basics

The links posted here are to maps created using ERDAS IMAGINE 2010 software as part of the University of West Florida On-line GIS Certification program class, Photo Interpretation and Remote Sensing (GIS4035/L). The links require Internet Explorer to open and display properly.

The goal of the assignment was to use reflectance characteristics of known features in a satellite photo and different spectral band combinations measured by LANDSAT Thematic Mapper to identify said features. The first feature identified is water which has a very high absorbance for infrared radiation (IR) and so appears darker in infrared images. The second map shows a glacier which is somewhat the opposite of the water, reflecting much of the radiation in the lower visible and infrared layers. The last image shows an area of shallow water where the bottom can be seen in the image and is actually reflecting more IR radiation then deeper water would. Such situations can make it difficult to properly discern where features begin and end.

Map 1 - Water Feature

Map 2 - Glacier Feature

Map 3 - Shallow Water Feature


The lab was very interesting. I experimented with all the bands as can be seen in the images which are each set to different color combinations. For the glacier I actually used a combination labeled for Desert details but felt it was a better contrasting image then the plain IR. I did have some issues getting the map images together in remembering how to do it from last weeks labs but by the third map I had become pretty efficient. I could not figure out how to make a map template and will look further into doing so, as it does seem to save a little time.

Sunday, June 27, 2010

Remote Sensing Module 1 Challege Assignment

The link posted here is to a map created using ERDAS IMAGINE 2010 software as part of the University of West Florida On-line GIS Certification program class, Photo Interpretation and Remote Sensing (GIS4035/L). The link requires Internet Explorer to open and display properly.

The map is a remotely-sensed image of part of the city of Pensacola, Florida. As this is the first challenge in the class, the goal of the challenge was to create a map from the initial image that contains all the usual map elements using the ERDAS tools. I chose to highlight two target features that stood out on the image, Pensacola Naval Air Station and a feature in the northwest portion of the map with an unknown identity which I have highlighted using one of the ERDAS symbols for indicating "unknown".

Module 1 Challenge - Pensacola

I had a lot of trouble initially with the ERDAS software. As with Adobe Illustrator in last semesters class, the user-friendliness in the program was not immediately intuitive and it took a long time just to get a map image that looked reasonable to me to display as a final submission. There also seemed to be some refresh issues when I was placing the scale bar. Further, I could not figure out how to set the scale bar settings so that I could control the configuration to look like I wanted. The scale is set when the annotation is created and so you can't really re-size it after the fact so I just kept playing with the size until I found something reasonable. However, the software does not seem as amenable to making maps as GIS or AI so hopefully, at some point, we will be able to export to one of those applications for the final map production.

Sunday, April 18, 2010

Final Project: U.S. SAT Scores and Participation

The displayed map was created as the final project for the University of West Florida Online GIS Certification program class, Cartographic Skills, (GIS 3015/L). The map was composed using ArcGIS ArcMap software and finished in Adobe Illustrator.

Midwest Excellence? Comparing mean test scores, students from Midwestern and mid-Southern states seem to excel at the SAT. However, these states generally have lower participation rates compared to other states. The higher scores are most likely attributable to participation rates as students from these states more frequently take the ACT.

Tuesday, April 6, 2010

Module 11 - Google Earth

The displayed map was created as part of the University of West Florida Online GIS Certification program class, Cartographic Skills, (GIS 3015/L) for the Week 11 lab exercise: Google Maps. The map was composed using Google Earth to identify and add an annotated placemark for a proposed wind farm location in the Great Lakes region. Screen shots were captured to create the main and inset images which were saved into the Microsoft Paint program then exported as a PNG file. The PNG file was imported into Adobe Illustrator(CS4) for finishing.


Lake Erie-Ashtabula-Conneaut Wind Farm

Justifications for Lake Erie-Ashtabula-Conneaut Offshore Site

An Ohio location was desirable due to Ohio's overwhelming public support for wind farms as noted by Green Energy and multiple other studies.

The specific site was chosen based on NOAA National Data Buoy Center data for the Conneaut Break Water Light buoy (CBLO1) showing an average annual wind speed falling within 5 (minimum working speed) - 15 (full capacity speed) meters per second for an average annual percentage of 56% of measuring events (an event had an average duration of 11 hours). This was the highest average rate of any of the buoy stations on Lake Erie in Ohio.

After searching for land-based sites near to the water and not finding any that seemed suitable, the idea of locating the wind farm offshore seemed like the more feasible possibility. Research online revealed the Great Lakes Wind Energy Center (GLWEC) Feasibility Study - Final Feasibility Report which stated among other things that Lake Erie presented the best Wind Resource in Ohio. Further research turned up the Wind Turbine Placement Favorability analysis which seemed to indicate that a site with a buffer of between 4-5 miles from shore midway between Ashtabula and Conneaut, presented only moderate limiting factors as a wind farm site. The chosen location is within shipping lanes and is actually in close proximity to the Cleveland Electric Illuminating Company - Ashtabula Power Plant, a potential electrical grid-connection point. The 4-5 mile buffer is far enough to mitigate any adverse affects due to noise, shadow flicker and visual impacts.

With regard to wildlife, European studies show that most waterfowl and seabirds detour short distances around wind farms so the proposed site is unlikely to significantly affect migrating birds along the one migration pathway that crosses through the site location. Also, based on European studies, habitat loss (i.e. foraging ground) should be minimal due to the distance offshore of the farm. Additionally, according to the GLWEC Final Feasibility Report, long term, it is possible that the foundation structures will actually create favorable marine habitat similar to artificial reefs found in the ocean.

While the site has some risk factors involved it actually seems to be a better location then sites that are in current consideration around the city of Cleveland.

Tuesday, March 30, 2010

Module 10 - Isopleth Maps

The displayed map was created as part of the University of West Florida Online GIS Certification program class, Cartographic Skills, (GIS 3015/L) for the Week 10 lab exercise: Isopleth Maps. The map was designed using Adobe Illustrator (CS4).


The map was created by manually interpolating points for the contour line between various data points that were overlaid on the map and then hidden when the final map was produced. For some points, I eyeballed it when, for example, the contour point was about halfway between the points. At other times I used a calculator and ruler to figure out a proportional close approximation.

The contours were drawn in CS4 using the Pen tool then smoothed out using the smooth tool which really was the workhorse tool in making the map because it allowed me to get nicely-smoothed continuous contour lines. So the process was Pen tool - click-a-point, click-a-point then Smooth tool - smooth the curve, smooth the curve, smooth the curve, until the contour looked like the end result. Actually the process was pretty fun.

Finally, the question of whether to fill in the space between the contours came up. I looked at various labor intensive ways of doing so, even going so far as to color the first two contours in the upper right part of the map. However, I did not like the way they looked compared to how the map looks without the shading which allowed me to concentrate the effect of figure ground by using a gray fill to frame the state map. When I darkened that fill slightly, I could really see the contour lines stand out. My big concern was what to do with the empty space but as solutions I shortened up the bottom white area below the neatline and then placed my legend info in the triangular area in the Northeast quadrant of the map. In the end I am quite satisfied with the map.

Sunday, March 21, 2010

Module 9: Flow Maps

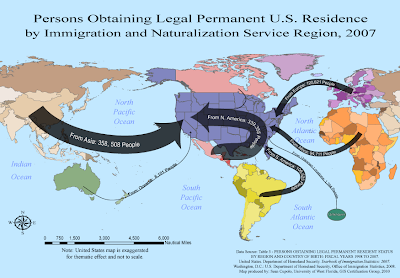
The displayed map was created as part of the University of West Florida Online GIS Certification program class, Cartographic Skills, (GIS 3015/L) for the Week 9 lab exercise: Flow Maps. The map was generated using ESRI ArcGIS - ArcMap and then exported to Adobe Illustrator (CS4) for editing and thematic elements.


How to describe the Flow Mapping experience ... to paraphrase from the words of Sheldon Cooper from the TV show, The Big Bang Theory, whilst he was paraphrasing Khan from the movie, Star Trek II: The Wrath of Khan, in reference to the actor Will Wheaton .... it tasked me.

I started this map on Tuesday and am finishing it on Sunday, I did not work on it every day but spent a considerable amount of time trying to deal with the particulars of showing the flows in the way I wanted to present them. I had worked out a sketch on Tuesday for the theme and was very happy with it. However, it involved centering the United States within the map. In Arc I used the suggested projection after looking at a couple of others because I thought I could work with it, but when I got to Illustrator, I had lots of problems making things look the way I wanted. First to center the U.S. required cutting Asia in half and then grouping all the elements in Asia that needed to be moved. That task alone was several hours worth of work because there were so many individual objects and long moments were spent just waiting for the objects to be moved up the layer panel so they could be grouped. I got better toward the end, turning off the new layer so objects disappeared and sub-grouping objects in the original layer to try to shorten the list, but it would seem that there has got to be an easier way to do what I wanted and I'll seek advice from the instructor, Trisha, on a better method.

I also felt the map would look better if I colored individual countries in a region with a different shade of a particular color, rather then having one uniform color for the whole region. Shades allow the user to keep the whole region as a unit in mind while at the same time hinting that the data does come from individual countries after all. Doing so was not too hard but again, because there were so many objects, it was a time consuming task, especially trying to decide which shade to U.S. In the end I'm fairly happy with the way it looks, but not sure it was worth all the effort.

Once I got the U.S. centered, I wanted to expand it in a way that was thematically pleasing and made the U.S. the focal point of the map but did not want to distort the general map layout much to preserve the sense of spacial distance that people would travel to permanently move to the U.S. Again this proved to be more difficult then I'd expected, but I am somewhat happy with the result. I had my wife look at the map and she did not immediately focus on the fact that the U.S. was out of scale nor felt if detracted from the map, so I think that thematic idea worked.

Lastly, I did not want to bother with a legend on this map because there did not seem to be enough legend worthy information. I felt it'd be possible to incorporate the immigration data within each flow line. This also gave me a chance to play with placing text on a path, something I had not worked with in the previous typography lab. Again, it was difficult to get everything the way I wanted - drawing the lines, placing and sizing the text, centering the text on the line. I had to draw the line, place, adjust and center the text, then add the point size for the line and the arrow head, then adjust as needed. In the end I am very pleased with how this part of the map turned out and once I learned the steps was able to add each flow-line without incident.

I am pleased with what I finally achieved because the map does work thematically.

Wednesday, March 10, 2010

Week 8 Dot Distribution Maps

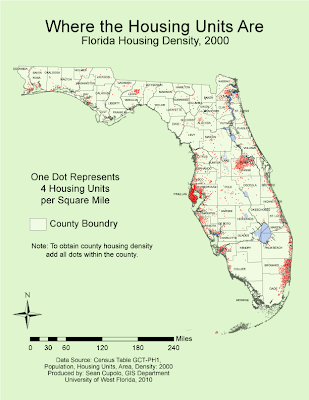
The displayed map was created as part of the University of West Florida Online GIS Certification program class, Cartographic Skills, (GIS 3015/L) for the Week 8 lab exercise: Dot Maps. The map was created using Adobe Illustrator to add the dots to a preloaded map of Florida counties.


Maybe spring break got me a little off my game, but the lab seemed very confusing to me, particularly the issue of whether to use dots that represent a raw data unit or a density unit. I used the density unit after following class discussions as a means to try to adhere to the original instructions. Adding dots was a time consuming process though not actually that difficult.

Most of the dots were added dot-by-dot because I tried to place dots relative to the way the actual population might be distributed. For example, dots were clustered around large cities such as Orlando and Tallahassee then outlier dots would be placed in locations of other smaller towns in the county. In counties with lower population densities, a dot would be placed proximate to where each town was located and additional dots would be dispersed within proximity to whichever towns may have a larger population. Geographic feature layers such as marsh and water were used to limit the placement dots to suitable housing areas and a geographically weighted approach was used when placing dots in a county adjacent to a more densely populated one. For dot size I chose a size of 0.75 point which seemed to allow coalescing in the densest county, Pinellas, but was still easily distinguishable in counties with lower densities.

It was very helpful to use the filtering feature in Excel to select each county as I worked on it since the Excel table was in alphabetical order. In general, after adding all the dots for Pinellas and setting my dot size and dot value, I worked the map from Northwest to Southeast going county by county. Wikipedia was found to be very helpful for the task because it was hard to see some of the county borders and I had to adjust several of the border labels as well. Each county can be looked up in Wikipedia simply by searching for it and each county entry has an inset map of Florida with the county highlighted. I really didn't have to use the layering and grouping features much for the lab, though the compass and scale bar were grouped as objects to make them easier to move and adjust. The scaling feature really helped a lot as I had not known how to scale mathematically prior to the lab and was trying to use the scaling tool, a dicey proposition at times.

Sunday, February 28, 2010

Week 7 - Proportional Symbol Maps

The displayed map was created as part of the University of West Florida Online GIS Certification program class, Cartographic Skills, (GIS 3015/L) for the Week 7 lab exercise: Proportional Symbol Maps. The map was generated using GIS ArcMap software and then exported to Adobe Illustrator for finishing and adding the proportional circles.


I decided to try something different this time by making the mapped area white and the background gray in hopes that it would add figure-ground appeal. I didn't like how the map first looked with black borders so the border was lightened several shades. When I started adding my proportional circles, I intended to use opaque black circles thinking they'd stand out really well. However, using opaque circles presented a problem in that a lot of the countries were very small and also I felt it was important to try to preserve the country labels since that information would be useful to a map reader. Placing some of the larger circles, such as for Italy and France, sealed the deal because so much of the border was wiped out by the symbol and I did not like the way it looked. So I changed the symbol to dark gray and then set a transparency so borders and labels could be seen. In the end I chose a transparency level of 90% opaqueness which is almost full opaqueness but seems to retain the ability to see the necessary information. I also moved a lot of the country labels to places where they could more easily be read adding leader lines as needed. I did add the amount for Germany to my map although I'm not sure we were supposed to. For the one country that I found that was not a wine producing country I shaded the entire country with a 50% white to black gradient which allows it to stand out but not overwhelm the other parts of the map.

For the legend I chose to create a set of six symbols based on applying something close to the optimal method for choosing the first 5 symbols and then adding a sith in the large gap between two symbols.

Creating the circles and getting them into position and working them in with the labels was time consuming and painstaking as was creating the legend.

Monday, February 22, 2010

Module 6 - Choropleth Mapping

The posted maps were completed as part of the Week 6 lab for the University of West Florida Online GIS Certification program class, Cartographic Skills (GIS 3015/L), and demonstrate techniques in choropleth mapping.

Color Choropleth Map
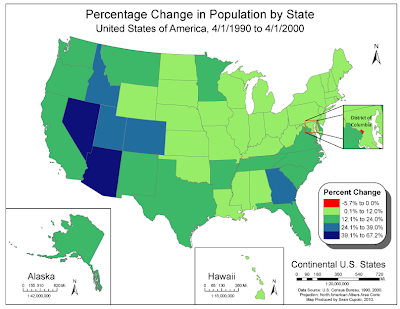
The first map is a color choropleth showing the population change by state for the United States from April 1, 1990 to April 1, 2000. The map was generated using ArcMAP and exported for finishing in Abobe Illustrator (CS4).


Generating the map in ArcMap was fairly straightforward process. I actually created 4 data frames to get the Alaska, Hawaii and DC insets. I used a contrasting red for the negative population growth, not realizing only DC was going to show that number. Probably could have avoided doing so, but I thought that was an interesting thing to highlight. I tried to use the Color Brewer web site but found the light color not to my liking for the map because too many border states were light and seemed to fade into the background.

Black and White Choropleth
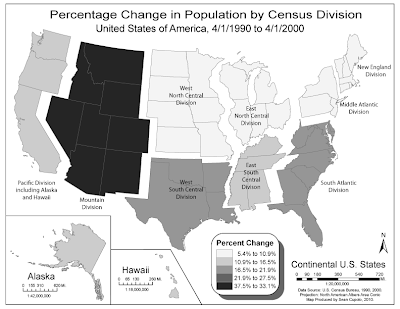
The next map is another choropleth showing population change, however this time by U.S. Census Divisions. The idea was to take the first choropleth map and alter it in Adobe Illustrator to create a new map with new information, divisions and such.


Creating the map was actually pretty fun though somewhat painstaking. The project first required running calculations from the state population data to obtain division data. I used Excel for the task printing out my work and it helped me organize the ideas for how I would display the map and make sure I selected the correct states for each division.

Knowing that the map would be gray-scale, I wanted to try to create a visual separation on the divisions and decided to "float" them away from each other. Since this is a thematic map, I feel that doing so is acceptable because of the visual effect it adds to the thematic goal of the map. However, in order to be able to move a division, I had to group all the states in the division into one group layer to make it easier to select a division, adjust it's position then select another division. Grouping also made coloring the states a snap as I could just select the group and hit the swatch color for that class which I set up beforehand. Trisha, thanks for reminding us to re-watch that Abode tutorial on Layers and Groups it helped immensely.

Al in all I'm pretty happy with both maps.

Sunday, February 14, 2010

Module 5 - Map Composition

The following map was created for the Map Composition module of the University of West Florida Online GIS certification course, Cartographic Skills (GIS 3015L). The map was created using Adobe Illustrator (CS4).


The goal of the assignment was to take various components of a typical thematic map and organize them in a cohesive and aesthetically effective manner to convey the map's information. The layout presented above accomplishes the goal by focusing on the thematic map which had to be enlarged to scale and then balanced to the other elements (insets, legend, scale bar, north arrow). It was quite a challenge to get the elements arranged correctly and I was only pleased with the composition after re-positioning the Florida inset in the bottom corner with the US map above it creating a "stacked building" effect on the left side that settles the viewers gravitational unease. Originally, the legend had a border as well, but I realized it really did not need it because it was in-kind part of the main map at that point. The insets were given a color fill to create contrast to the main map, as well as to each other to seal the deal. At that point, a defined diagonal framing of the main map was created that balanced the diagonal shape of the part of Florida being highlighted. I considered changing color schemes for the thematic map, but the compositional elements made it unnecessary. However, pretty much every element in the map was re-sized in some format (i.e. the scale was halved in thickness and a segment removed to shorten it to scale) and all the type was changed to Ariel and re-sized to various point sizes.

My best friends in Illustrator were the Layers frame which I used religiously to lock and hide objects and layers and the Direct Selection tool which made selecting the maps as one piece very easy. I had problems using the Scale tool until I realized it was easier to use when the image was enlarged.

Saturday, February 6, 2010

Module 4: Typography

The map shown below of the middle section of the Florida Keys was created for the Typography lab for the University of West Florida on-line GIS certification program class, Cartographic Skills (GIS 3015/L).


The map was not created using ArcGIS but rather was created in Adobe Illustrator. Students were given the map outline and had to use their understanding of typography rules for map-makers to locate and label various features in this area of the keys. I can honestly say that doing so proved tremendously frustrating as there was a lot about the Adobe program that was very foreign to me and not easily understood. For example, I wanted to color in the state park and country club land areas in green, but was at a loss how to easily fill an area. The closest I came was using a paint-like feature which took forever, created multiple objects, and had zero precision. I'm sure there's a better way to do it, but the Adobe help to say the least is least helpful. I now strongly regret not downloading a trial of this version before starting the course.


I do feel like I learned quite a bit about using the program. The zoom feature was very useful in placing labels and I did arch a few of them to get them to fit in to tight places. I only used two types for the elements, one serifed and one sans serif. There were elements and rules followed for this map that I did not pay attention to previously and hope to keep in mind for the next labs.

Monday, February 1, 2010

Module 3 - Data Classification Lab (Escambia County, FL)

The following maps were created for the University of West Florida 2010 GIS Certification program course, Cartographic Skills (GIS 3015/L) using ArcGIS. The maps depict the African population percentage of Escambia, FL based on year 2000 census data.


The first map shows four chloropleth maps of Escambia county using different data classification methods: Equal Intervals, Quantile, Standard Deviation and Natural Breaks.

Which Classification best represents the data and why?

To answer the question I looked at the way the data was spread using the Classify button under the Symbology tab and noted the leftward skew of the data indicating that the majority of census tracks in Escambia county have low population percentages of Africans (36 of 58 are roughly 25% or less) while three have very high percentages (86%, 88.1%, 95.6%). As such, the best map of the data should highlight these two extremes, especially the high percentage tracks.

Examining the distributions created by each of the four Data Classification methods helped to identify which classification best displayed those aspects. The Quantile method was rejected because it spanned too great a range of values, 44.6 – 95.6 (over 50% of the total range), into one Class break. The Standard Deviation method was rejected because the distribution of the data was not normally distributed. The Natural Break method was rejected because it did not isolate the high percentage values, even after adding up to 13 breaks.


The Equal Interval classification seemed the best fit because its legend isolated most of the tracks under 25% into one interval and had a higher starting percentage for the upper range, much closer in value to the high percentage tracks, making them easily identified on the map and providing a better indicator of their outlying nature.

Sunday, January 17, 2010

Module 1 - Thematic Cartography Lab Assignment

Map Critique - The Good, The Bad and the Awesome

Displayed below are examples of a what I think are a good map, a bad map and, just for fun, an awesomely good map.

The Good .....
The map displayed immediately below was first discovered by me on the website/blog, StrangeMaps (http://strangemaps.wordpress.com) under the November 11, 2008 post titled - 330 – From Pickin’ Cotton to Pickin’ Presidents. It was originally overlaid by Allen Gathman (http://gathkinsons.net/blog/?p=371), a biology professor in Missouri.


The map is an overlay of two maps that were created over 100 years apart. The dots represent cotton production in the southern United States from a map from 1860 (each dot = 2,000 bales) and have been placed over a chloropleth map from 2008 depicting results on the county level of the 2008 presidential election (Blue counties voted for Barack Obama, red ones for John McCain). The combined thematic map demonstrates the correlation between cotton producing areas in the south and the tendency of those areas to vote democratic which can be explained by the facts that a) 90% of African Americans voted for Obama in 2008 and b) African Americans imported as slaves to grow cotton have a settlement pattern that still corresponds strongly to that time.

I believe this is a good map because it satisfies Krygier's 1st commandment to map substantial information or non-boring data. Indeed, the publication of the map has spurred further research to show that the pattern is not just a function of land use in the Deep South, but also a function of soil type. The part of the map represented by the crescent is called the Black Belt, so named for a certain type of soil found there (from The Vigorous North website http://www.vigorousnorth.com/2008/11/black-belt-how-soil-types-determined.html). The Vigorous North researchers went further using maps from the Late Cretaceous to suggest area represented by the crescent was, back then, a shallow sea teaming with life which "laid the deposits that would eventually become the rich "black belt" soils".

Additionally, the map satisfies Commandment 2:Don't Lie with Maps because data is shown and represented truthful and there is no design variation and Commandment 4: Minimize Map Crap since the map really only shows the two data elements overlaid.

The Bad .....
As for a bad map, I have posted this one, a map of London showing after dark club locations:


This is a bad map for a number of reasons. Even at high magnifications, the symbols indicating the locations of the clubs blocked most of the street level detail on the map. It was nearly impossible to tell exactly where each club was located. Furthermore, there is no context indicating whether these where all the clubs in London or just select ones based on a specific criteria such as the map-makers preference. Finally, the colors used to indicate the different types of clubs were both unappealing and unrelated in any way to the types of clubs (Why black for casinos?). Pictographs within the symbols may have served a better purpose. All-in-all, the map is one that I could not see being useful to anyone without much more information.

and the Awesome .....
This ones just for fun, but I've included it here because it is perhaps the most important map in the world to me and is not just a good map but an awesome one:


For those who do not recognize it, this is the map of J.R.R. Tolkien's fantasy world, Middle-Earth from the book series, The Lord of the Rings. This was the first map that had real importance to me. As a 12 year old reading these books for the first time, Tolkien's map was critical in helping me visualize the story. I'd read some pages then flip to the map to plot the course of the characters and truly become immersed in this imaginative world. It is the first map I fell in love with.

And the map doesn't disappoint. While it is a fictional place, the map has all the detail that one would expect. All the crucial and critical places from the story are located on the map. Additionally, places only referred to are seen in relation to the critical countries and cities where the story takes place. The style is spare but the detail is rich, interesting and substantial. Map Crap is minimized except for maybe the border, but even then it is understated and in keeping with the purpose of the map.

Finally, it cannot be underestimated how valuable the creation of the map was to the ultimate success of the novels (and subsequent billion dollar generating movies and other ancillary ventures based around the books). These novels have been characterized as one of the most realistic creations of an imaginative world ever penned to paper and one can not help but realize how important creating a realistic map was to that endeavor. Without the map, it is possible the books would never have achieved the measure of success they did, evidenced by the numerous websites where, to this day the maps are recreated, studied and admired fondly.